Difference between revisions of "The MySQL Query Browser"
(→A Tour of MySQL Browser) |
(→A Tour of MySQL Browser) |
||
| Line 41: | Line 41: | ||
The large gray area in the center of the screen displays the results of the executed statements. An addition section at the bottom of the window appears to display any errors encountered as a result of a SQL statement. | The large gray area in the center of the screen displays the results of the executed statements. An addition section at the bottom of the window appears to display any errors encountered as a result of a SQL statement. | ||
| − | In the top right hand side of the window is a list of databases available on the server to which the tool is currently connected. Clicking the arrow next to any database will display the tables contained therein. Clicking on the arrow next to a table sill. similarly list the columns in that table. Right clicking with the mouse in this area pops up a menu providing options to create new tables, views and databases. This menu also provides an option to select a different schema to the one chosen at the login screen and provides the option to drop | + | In the top right hand side of the window is a list of databases available on the server to which the tool is currently connected. Clicking the arrow next to any database will display the tables contained therein. Clicking on the arrow next to a table sill. similarly list the columns in that table. Right clicking with the mouse in this area pops up a menu providing options to create new tables, views and databases. This menu also provides an option to select a different schema to the one chosen at the login screen and provides the option to drop the currently highlight table or database. |
| − | The bottom right side of the main window provides a | + | The bottom right side of the main window provides a list of help topics. Double clicking on a list item will display help text in the result area of the screen. |
== Executing SQL Statements == | == Executing SQL Statements == | ||
Revision as of 19:07, 1 October 2007
The MySQL Query Browser is a graphical tool designed to provide a user friendly environment in which to write and execute SQL statements.
Getting and Installing MySQL Query Browser
As with the MySQL Administrator, the MySQL Query Browser is not installed as part of the core MySQL software package. Both pre-built versions of the tool for Windows, Linux and Mac OS and the source code for the this tool can be obtained from:
http://dev.mysql.com/downloads
The Windows version of the GUI tools are supplied as an installer executable. To perform the installation, simply launch the installer once the download is complete.
The Linux version of the tools can be downloaded using RPM (note that the filenames may change for later releases or different Linux versions of the software):
su -
rpm -ihv mysql-gui-tools-5.0r12-1rhel4.i386.rpm
rpm -ihv mysql-query-browser-5.0r12-1rhel4.i386.rpm
On Windows, the MySQL Query Browser can be launched from the Desktop Start menu. On Linux, the tool is launched as follows:
mysql-query-browser
Connecting the MySQL Query Browser to a Database Server
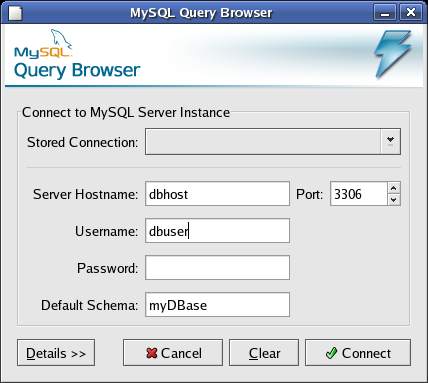
When the MySQL Query Browser tool starts the following login screen will appear:
Enter the name of the host on which the database server resides, together with appropriate user and password credentials. Finally, specify the name of database in the Default Schema field on which you wish to work during the Query Browser session (note that you can switch to a different database later from within the tool). Click on the '"Connect button to connect to the specified server.
A Tour of MySQL Browser
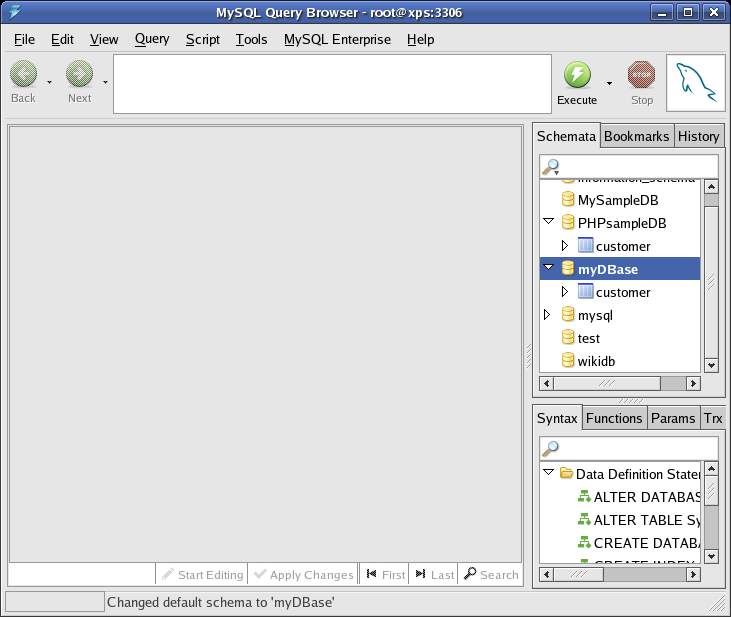
Once connected to a database server, the following screen should appear:
At the top of the window is a large text input field. this is where SQL statements are typed by the user. Statements can be entered on multiple lines and are not executed until the execute button is pressed (the round green button with the white lightning bolt). An executing statement can be stopped by pressing the red stop button. The Back and Next buttons provide a way to page through the history of executed commands.
The large gray area in the center of the screen displays the results of the executed statements. An addition section at the bottom of the window appears to display any errors encountered as a result of a SQL statement.
In the top right hand side of the window is a list of databases available on the server to which the tool is currently connected. Clicking the arrow next to any database will display the tables contained therein. Clicking on the arrow next to a table sill. similarly list the columns in that table. Right clicking with the mouse in this area pops up a menu providing options to create new tables, views and databases. This menu also provides an option to select a different schema to the one chosen at the login screen and provides the option to drop the currently highlight table or database.
The bottom right side of the main window provides a list of help topics. Double clicking on a list item will display help text in the result area of the screen.


