Measuring Revenue Lost to Ad Blocking
The extent to which ad blocking impacts a website will vary from one site to another and is often dictated primarily by audience demographics. Current trends suggest that websites appealing to a younger or more technically oriented audience are likely to encounter a greater percentage of ad blocking activity than other types of website.
The first step in considering how to mitigate the effects of ad blocking, therefore, is to identify not only whether the problem exists, but that it does so to the extent that further action is justified. If only 10% of visitors to a website are using an ad blocker, for example, the website owner may reasonably make the judgement that the effort involved in adapting to the threat outweighs the benefits. To make this an informed decision, however, it is first necessary to gather and analyze website visitor behavior data.
The focus of this chapter, therefore, is to outline some steps that can be taken to obtain accurate data on how many visitors to a website have an ad blocker enabled. Two levels of ad blocker tracking will be introduced in this chapter. The first provides a simpler approach using a free service provided by PageFair (another free service, AdBlock X, will also be covered in the chapter entitled Reviews of BlockAdBlock, AdSorcery and AdBlock X). The second option makes use of Google Analytics and provides a greater level of detail and data collection options.
Tracking Ad Blocking with PageFair
For those in a hurry, the path of least resistance to tracking the percentage of ad blocker usage on a website is to sign up for a PageFair account. In addition to providing ad blocker tracking, PageFair also provides an option to generate revenue from some blocked ads, a topic that will be covered later in this book. For the purposes of this chapter, however, only the ad blocker measurement service will be used.
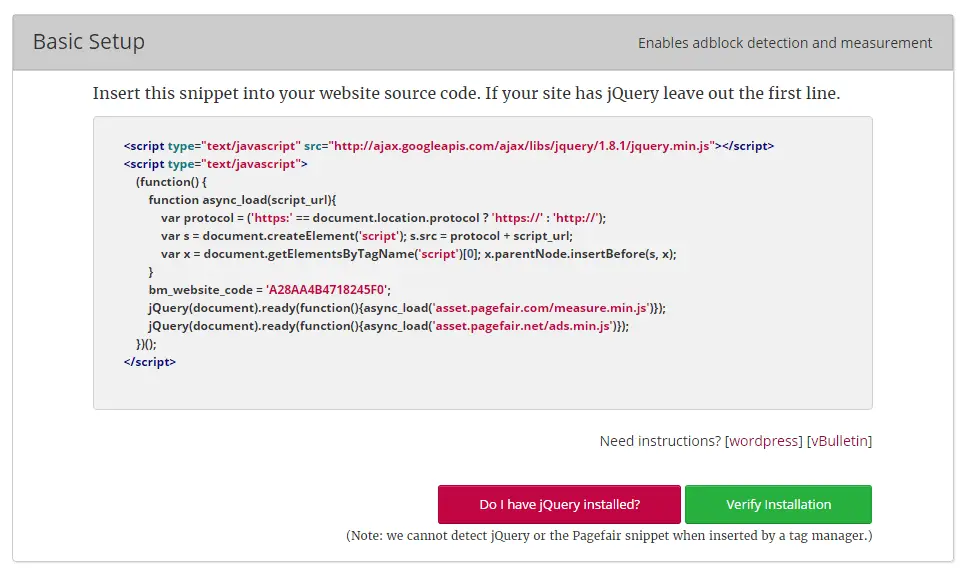
Visit https://pagefair.com and create a new account by entering your email address, password and website information. Once signed into PageFair, select the Setup tab to locate the ad block detection and measurement JavaScript code as illustrated in Figure 5-1:
Figure 5-1
The PageFair JavaScript code makes use of the jQuery JavaScript library. If your website already imports this library it will not need to do so again. Before adding the measurement code to your website, click on the Do I have jQuery installed? button. If PageFair detects that jQuery is already installed, it is not necessary to include the first line of the code in your web pages.
For WordPress based websites the code can be added via the Theme Editor within the WordPress dashboard. Instructions to achieve this can be viewed by clicking on the WordPress Need instructions? link on the PageFair setup screen. For other sites, cut and paste the code into the appropriate location within your website markup so that it is placed between the header <head> and </head> tags and is included in every page for which tracking is required.
If you are using a WordPress installation, select the Appearance option from the WordPress dashboard followed by Editor as outlined in the previous chapter. From the drop down menu in the upper right hand corner of the main panel, select the theme you are using for your website and click on the Select button.
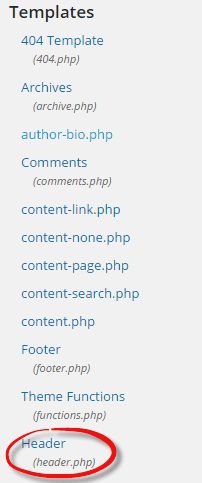
Next, select the Header (header.php) entry from the Templates list located on the right hand side of the page as shown in Figure 5-2:
Figure 5-2
Once the code for the header template is displayed, paste the PageFair code into the template so that it is positioned immediately before the </head> tag:
Figure 5-3
Click on the Update File button to save the changes, or follow the steps outlined in the previous chapter to add write permission to the following file (where <theme name> is replaced by the name of the WordPress theme you are using):
wp-content/themes/<theme name>/header.php
Once the code has been added to the website, click on the Verify Installation button to check that the code is correctly installed and functioning.
Reviewing the PageFair Results
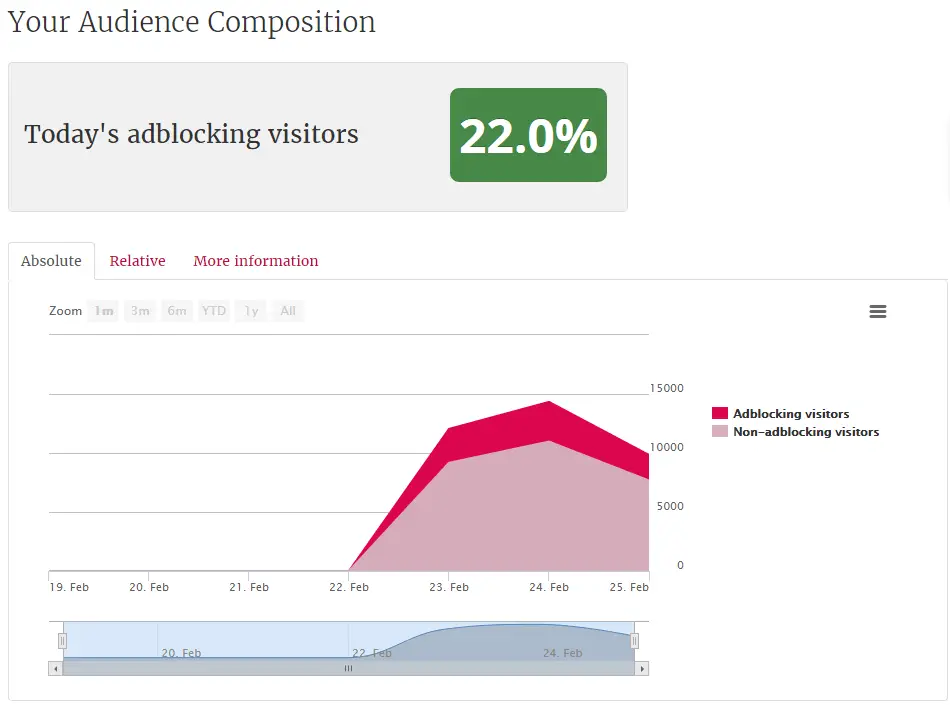
It may take up to 24 hours for tracking results to become available within the PageFair dashboard. To view the results, select the Reports -> Audience option within the PageFair dashboard to display the data in graph form:
Figure 5-4
The above audience report displays the percentage of ad blocking activity on a per visitor basis. For traffic breakdown based on individual page views, select the Reports -> Traffic option.
Tracking Ad Blocking with Google Analytics
Measuring ad blocking using Google Analytics requires slightly more work than using PageFair but has the advantage of bringing the full power of Google Analytics to bear when measuring ad blocking behavior. Data available within Google Analytics includes the geographical location of visitors, browser and device type in use and the operating system on which the browser is running. The fact that many web publishers already use Google Analytics also makes this an ideal choice for measuring ad blocking activity on a website.
The process of tracking ad blocking behavior within Google Analytics involves adding ad blocker detection code to each website page. This code is designed to trigger a different Google Analytics event depending on whether or not ad blocking is being used by visitors to the site.
Creating a Google Analytics Account
If you do not already have a Google Analytics account, create one now for free by going to https://www.google.com/analytics/, clicking on the “Sign In” link and selecting Google Analytics from the drop down menu. Enter the email address and password associated with your Google account if prompted to do so (or create a Google account if you do not already have one).
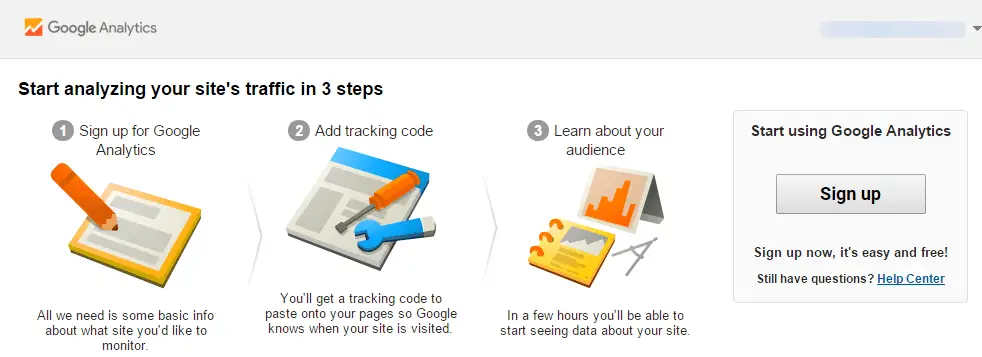
Having reached the Google Analytics sign up screen (Figure 5-5) click on the Sign Up button to begin the account creation process.
Figure 5-5
On the subsequent New Account form, select the “Website” option and enter the necessary information for your site to configure tracking. Having filled in the appropriate form fields, click on the Get Tracking ID button and add the code to your website so that it is included on every page that is to be tracked. If you are using WordPress, follow the steps above to place the code in the <head> section of the theme header.php template.
Detecting Ad Blocking
The next step in implementing ad blocker tracking is to add the detection code to the pages of the website. Once again, this code will need to be present in every page for which tracking is required. For the purposes of this example, the JavaScript detection code outlined in the chapter entitled Ad Blocker Detection Techniques will be repurposed to trigger Google Analytics events instead of sending output to the browser’s JavaScript console. As outlined in the previous chapter, the sample detection JavaScript code reads as follows:
<div class="banner_ad"> </div>
<script src="https://ajax.googleapis.com/ajax/libs/jquery/1.12.0/jquery.min.js"></script>
<script>
(function() {

        var detector = function() {
            setTimeout(function() {

                if(!document.getElementsByClassName) return;
                var ads =
			document.getElementsByClassName('banner_ad'),
                    ad  = ads[ads.length - 1];

                if(!ad || ad.innerHTML.length == 0
				|| ad.clientHeight === 0) {
                    console.log('Ad Blocker Detected');
                } else {
                    console.log('No Ad Blocker');
                }

            }, 2000);
        }

        /* Add a page load listener */
        if(window.addEventListener) {
            window.addEventListener('load', detector, false);
        }
})();
</script>
As an initial test, embed the above code into your website so that it appears on every page that is to be tracked. Make sure to place this code so that it is positioned beneath the Google Analytics tracking code added earlier in this chapter.
Display the JavaScript console for your browser (as outlined in the chapter entitled Ad Blocker Detection Techniques) and load different pages while enabling and disabling the ad blocker. Check the console output to verify that the code correctly detects the presence of an ad blocker by outputting “Ad Blocker Detected” and “No Ad Blocker” messages.
Triggering Google Analytics Events
Having verified that the code is correctly detecting the presence of an active ad blocker, the code now needs to be enhanced to trigger Google Analytics events. Edit the JavaScript detection code so that it reads as follows:
<div class="banner_ad"> </div>
<script src="https://ajax.googleapis.com/ajax/libs/jquery/1.12.0/jquery.min.js"></script>
<script>
(function() {

        var detector = function() {
            setTimeout(function() {

                if(!document.getElementsByClassName) return;
                var ads =
			document.getElementsByClassName('banner_ad'),
                    ad  = ads[ads.length - 1];

                if(!ad || ad.innerHTML.length == 0
				|| ad.clientHeight === 0) {
                    ga('send', {
                        'hitType': 'event',
                        'eventCategory': 'AdBlocker',
                        'eventAction': 'Blocked',
                        'nonInteraction': 1
                });

                    console.log('Ad Blocker Detected');
                } else {
                    ga('send', {
                        'hitType': 'event',
                        'eventCategory': 'AdBlocker',
                        'eventAction': 'Not Blocked',
                        'nonInteraction': 1
                    });

                    console.log('No Ad Blocker');
                }
            }, 2000);
        }

        /* Add a page load listener */
        if(window.addEventListener) {
            window.addEventListener('load', detector, false);
        }
})();
</script>
The tasks performed by these code changes are quite simple. If an ad blocker is detected, an event is sent to Google Analytics with the event category set to “AdBlocker” and the event action declared as “Blocked”. If no ad blocker is detected an “AdBlocker” category event is sent, this time with the event action set to “Not Blocked”.
Analyzing the Results
Although Google Analytics will begin recording and reporting data almost immediately, the amount of time it will take to gather meaningful statistics will vary depending on the volume of traffic to the website.
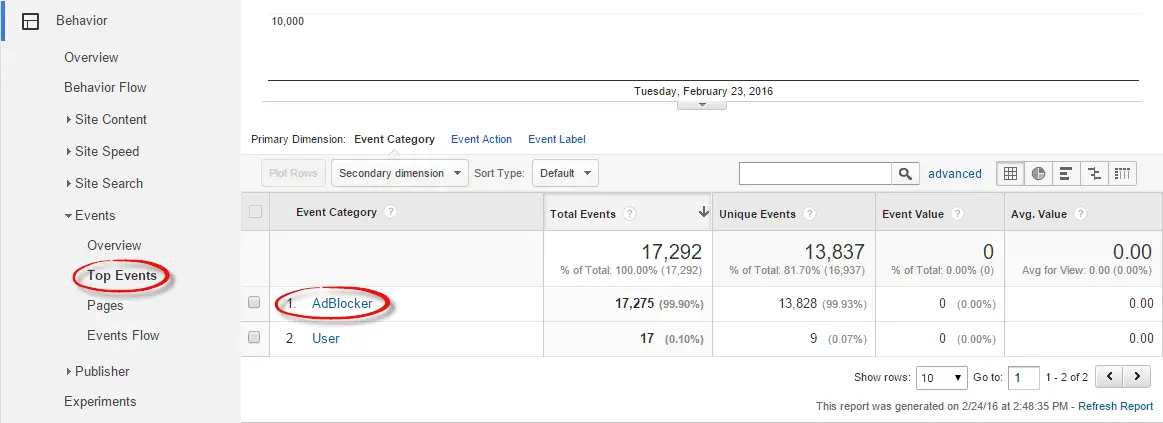
To view the statistics, open Google Analytics in a browser window and display the reporting information for the website. Within the left hand navigation panel, select Behavior -> Events -> Top Event to display information about the AdBlocker event category as highlighted in Figure 5-6:
Figure 5-6
Click on the AdBlocker category to view the data for the individual event actions:
Figure 5-7
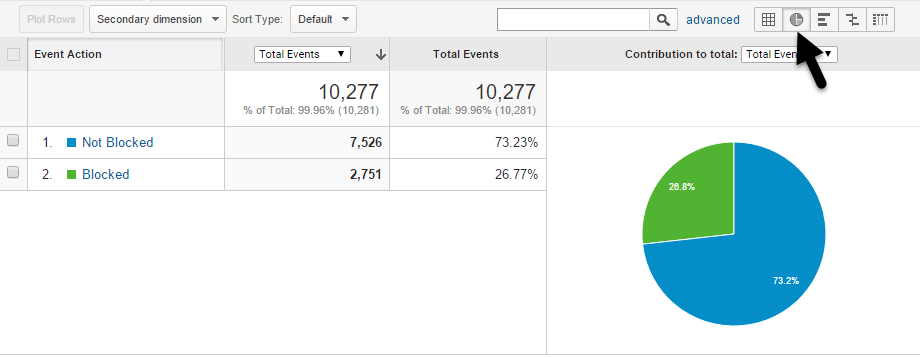
To access a graphical view of the event actions data, click on one of the buttons located in the right hand side of the toolbar. Figure 5 8, for example, shows the data in the form of a pie chart:
Figure 5-8
Refer to the Total Events column of the table to identify the percentage of visitors using ad blockers during the specified time and date range. To view statistics for different date and time ranges, or to compare one time period with another, use the panel located in the upper right hand corner of the Google Analytics page. In Figure 5-9, for example, a comparison is being configured between two different date ranges:
Figure 5-9
Creating a Segment for Ad Blockers
To gain access to additional information on those visitors using an ad blocker it will be necessary to create a new segment targeting those users. Begin by selecting the Audience -> Overview option from the left hand navigation panel and, within the main panel click on “+ Add Segment” as highlighted in Figure 5-10:
Figure 5-10
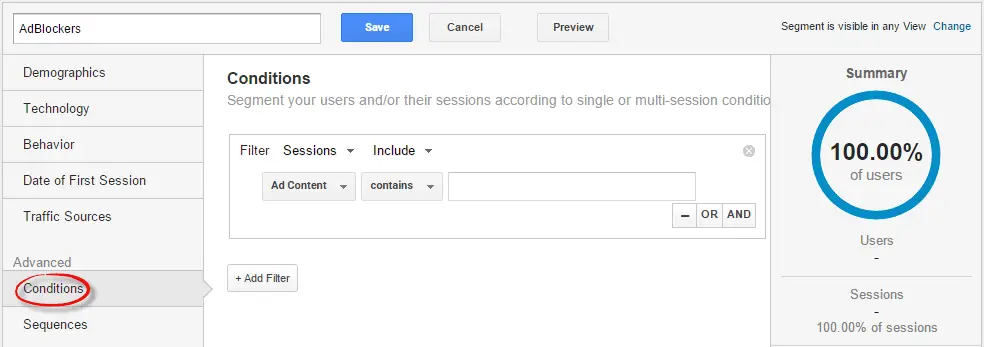
In the resulting panel, click on the red “+ New Segment” button to display the new segment configuration panel. In the upper section of the panel enter AdBlockers into the Segment Name text field before selecting the Conditions option located under Advanced in the navigation panel:
Figure 5-11
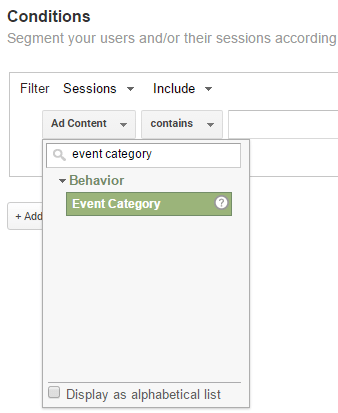
The objective here is to configure a new segment that contains visitors who triggered the “Blocked” event action of the “AdBlocker” event category. Within the condition settings, click on the Ad Content drop-down menu and enter event category into the search box to locate the Event Category entry:
Figure 5-12
Select the Event Category item from the list, change the condition setting to “matches exactly” and enter AdBlocker as the category name. At this point the condition filter should match that shown in Figure 5-13:
Figure 5-13
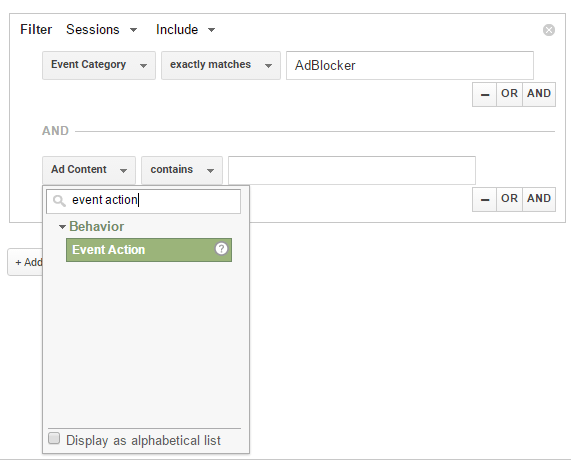
As currently configured, the segment will include all visitors that triggered AdBlocker category events regardless of which event action was triggered. The filter needs to be further refined to match only those entries containing a “Blocked” event action. Click on the AND button to add another condition to the filter and select the Ad Content button in this entry to display the drop-down menu. Enter event action into the search box and select the item from the list when it appears:
Figure 5-14
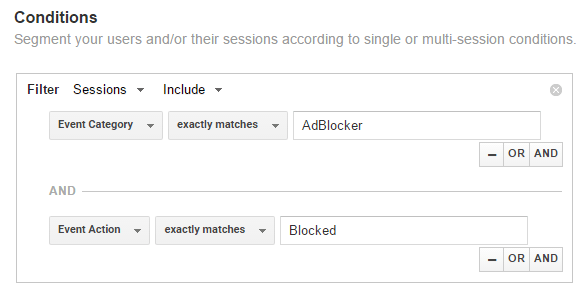
Remaining within the second filter configuration, change the condition from contains to matches exactly and enter Blocked into the text field. On completion of these steps the condition filter should read as shown in Figure 5-15:
Figure 5-15
Click on the Save button to commit the changes.
Analyzing the Segment Data
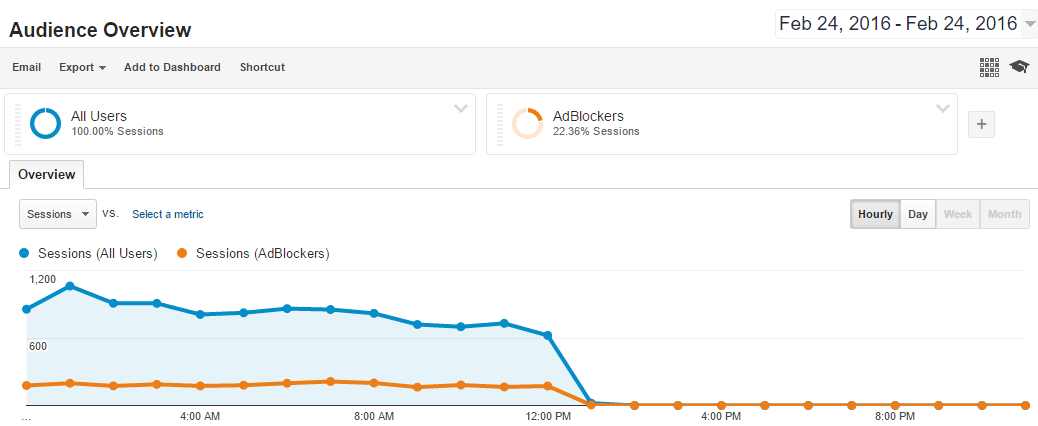
Once the segment has been saved it will automatically appear in the audience overview results as illustrated in Figure 5-16. This allows the percentage of visitors using ad blockers to be reviewed over different periods of time. Options are also available to compare the results to other time periods to track whether the situation is worsening.
Figure 5-16
Scroll down the page until the demographics section comes into view. Select the Country option to view geographical data on visitors using ad blockers:
Figure 5-17
Take time to explore other information such as browser type and operating system. The segment configuration will also provide information in other areas of Google Analytics. This information can be used to gauge the impact of ad blocking on your website advertising revenue. If most of your revenue is generated by customers in the United States, for example, but the majority of visitors using ad blockers are based in another country then the issue may not warrant further action.
Similarly, the operating system data might indicate that most visitors running Android or iOS are not yet using ad blockers. If the majority of your revenue comes from mobile ads then the problem may be less severe than the overall percentage of ad blockers at first suggests.
Adding and Removing the AdBlockers Segment
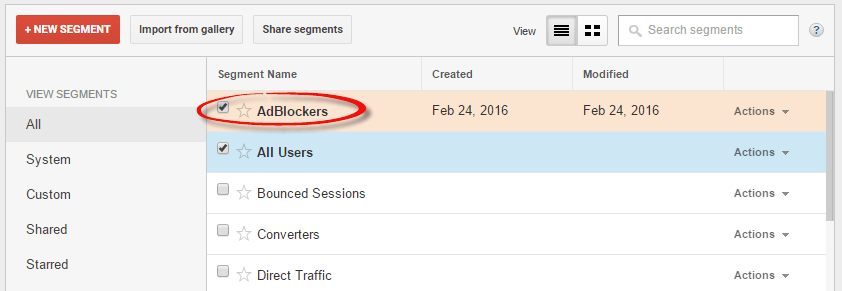
To remove the AdBlockers segment from the results within Google Analytics, click on the down arrow in the segment panel as outlined in Figure 5-18 and select the Remove option:
Figure 5-18
To reapply the segment to the analysis, click on the Add Segment panel and enable the AdBlockers check box within the segment list before clicking on the Apply button. If the AdBlockers segment data is to be displayed in relation to all other website visitors, be sure to keep the All Users option enabled:
Figure 5-19
Blocking of Tracking Scripts
It is important to be aware that some ad blockers provide the option to also block tracking scripts such as those provided by PageFair and Google Analytics. It is possible, therefore, that the results gathered using these techniques will not be 100% accurate. That being said, even with some users blocking tracking activity, the data gathered should be a large enough representative sample to provide a reasonably accurate assessment.
Summary
The impact of ad blocking will vary from one website to another. It is important, therefore, to gauge the level of ad blocking activity as a percentage of overall traffic. A quick assessment can be made using a third-party service such as that offered by PageFair. Alternatively, more in depth analysis may be performed using Google Analytics, allowing additional data such as geography and platform type to be monitored.
