Firebase Performance Monitoring
| Previous | Table of Contents | Next |
| A Firebase App Indexing Tutorial | Firebase Cloud Functions |
As the name suggests, Firebase Performance Monitoring is a service that allows app developers to review and monitor the performance of an app. In this chapter of Firebase Essentials, the key features of Performance Monitoring will be covered, including a short tutorial that demonstrates some of these monitoring features in action.
An Overview of Firebase Performance Monitoring
Performance monitoring is enabled by adding the Performance Monitoring SDK to an app project but without adding any additional code to the app. The SDK will automatically measure a range of performance metrics for the app, including startup time, foreground and background activity and HTTP/S network requests.
Performance monitoring is based on traces. A trace is the capture of performance data that occurs between two different points within the execution cycle of an app.
In addition to the automatic traces, Performance Monitoring also allows custom performance traces to be implemented within the app code. This allows monitoring to be started and stopped at different points in the app lifecycle to gain an insight into the performance of specific areas of app functionality. Custom traces may also be added to specific methods simply by adding a single annotation to method declarations within the source code of the app. Counters may also be created to monitor the frequency with which events occur within the scope of a custom trace (for example a counter could be incremented each time the app encounters a problem writing to a remote storage file).
In terms of the data included in performance monitoring, this includes app version, country, device, operating system, radio and carrier information. For HTTP/S network requests, the response time, payload size and success rate are also captured.
The results of performance monitoring are viewed within the Performance Monitoring section of the Firebase console.
Adding Performance Monitoring to a Project
For the purposes of demonstrating Firebase Performance Monitoring, the RealtimeDBList app created earlier in this book will be used. If you have already completed this project, open it in Android Studio now. Alternatively, the completed project can be found in the code sample download for the book available from the following URL:
http://www.ebookfrenzy.com/web/firebase_android
If the app has not yet been connected to Firebase, begin by selecting the Android Studio Tools -> Firebase menu option. When the Firebase assistant panel appears, check to see if you are using a version of Android Studio that includes the option for Performance Monitoring, select it and follow the steps to connect to Firebase and add the Performance Monitoring SDK before proceeding to the next section of this chapter.
If, on the other hand, you are using a version of Android Studio that does not provide a Performance Monitoring option, select the Analytics option and use that option to connect to Firebase. Once connected, edit the project level build.gradle (Project: RealtimeDBList) file and modify the buildscript dependencies section to include a reference to the Firebase plugins package as follows:
buildscript {
    repositories {
        jcenter()
    }
    dependencies {
        classpath 'com.android.tools.build:gradle:2.3.3'
        classpath 'com.google.firebase:firebase-plugins:1.1.0'
        classpath 'com.google.gms:google-services:3.0.0'
    }
}
Next, edit the module level build.gradle (Module: app) file to apply the performance plugin and to add a dependency for the Firebase Performance SDK:
apply plugin: 'com.android.application'
apply plugin: 'com.google.firebase.firebase-perf'

.
.
.
dependencies {
    compile fileTree(dir: 'libs', include: ['*.jar'])
    androidTestCompile('com.android.support.test.espresso:espresso-core:2.2.2', {
        exclude group: 'com.android.support', module: 'support-annotations'
    })
    compile 'com.google.firebase:firebase-perf:11.0.1'
    compile 'com.android.support:appcompat-v7:25.3.1'
.
.
.
}
Once these changes have been made and the app rebuilt, Firebase will automatically monitor the following traces:
• App Startup – Traces startup performance from the point that the app is launched until it becomes responsive to the user. This essentially covers the period of time from the app being opened up until the onResume() method is called in the launcher activity.
• App Background – Traces performance of the app while it is in the background. Trace monitoring begins from the point that the onStop() method of the last activity to enter the background is called. Monitoring ends when the onResume() method of the first activity to reenter the foreground is called.
• App Foreground – Traces performance of the app while it is in the foreground. Monitoring begins when the onResume() method of the first activity to enter the foreground is called and ends when the onStop() method is called on the last activity to enter the background.
• HTTP/S Network Requests – Traces the performance of an HTTP/S network request from the point that the request is made until the response is received. Data gathered includes the response time, the size of the request payload and the percentage of successful requests.
Defining Custom Traces
Custom traces are added to an app by specifying the trace start and end points within the code. Before custom traces can be added, the following libraries must first be imported. Begin, therefore by adding the following import directives to the RealtimeDBListActivity.java class file:
import com.google.firebase.perf.FirebasePerformance;
import com.google.firebase.perf.metrics.AddTrace;
import com.google.firebase.perf.metrics.Trace;
To start a trace, an instance of the Trace class needs to be created via a call to the newTrace() method of the FirebasePerformance instance, passing through the name by which the trace is to be identified. The trace is then started via a call to the start() method of the Trace object:
Trace trace = FirebasePerformance.getInstance().newTrace("file_save");
myTrace.start();
To end the trace, a call must be made to the stop() method of the same Trace object used to start the trace:
trace.stop();
Within the RealtimeDBListActivity.java class, add a custom trace within the addItem() method as follows:
public void addItem(View view) {

    String item = itemText.getText().toString();
    String key = dbRef.push().getKey();
    Trace trace = FirebasePerformance.getInstance().newTrace("add_item");
    trace.start();
    itemText.setText("");
    dbRef.child(key).child("description").setValue(item);

    adapter.notifyDataSetChanged();
    trace.stop();
}
If a trace needs to cover a method from beginning to end, this can be added using the @AddTrace annotation above the method declaration. Remaining within the RealtimeDBListActivity.java class file, add a trace to the deleteItem() method as follows:
@AddTrace(name = "deleteItemTrace", enabled = true)
public void deleteItem(View view) {
    dataListView.setItemChecked(selectedPosition, false);
    dbRef.child(listKeys.get(selectedPosition)).removeValue();
}
To implement a trace counter, simply call the incrementCounter() method of the Trace object, passing through the name by with the counter is to be referenced. For example, the following code change to the addItem() method will record every time that an item is added to the database list:
public void addItem(View view) {

    String item = itemText.getText().toString();
    String key = dbRef.push().getKey();
    Trace trace = FirebasePerformance.getInstance().newTrace("add_item");
    trace.start();
    trace.incrementCounter("item_add_counter");
    itemText.setText("");
    dbRef.child(key).child("description").setValue(item);

    adapter.notifyDataSetChanged();
    trace.stop();
}
If the counter needs to incremented by a value greater than 1, the value by which the count is to be increased is passed through as a second argument to the method:
trace.incrementCounter("item_add_counter", 10);
Enabling Logcat Output
Unfortunately, it can take up to 12 hours before performance monitoring results begin to appear within the Firebase console. To check that performance monitoring is working without having to wait for the Firebase console to catch up, it is possible to configure the app to report performance events within the logcat output. This involves the addition of an element within the <application> element of the project’s AndroidManifest.xml file as follows:
<application...>
        <meta-data android:name="firebase_performance_logcat_enabled" android:value="true" />
        <activity android:name=".RealtimeDBListActivity">
.
.
</application>
Compile and run the app and display logcat within the Android Studio Android Monitor tool window. When monitoring events are logged, they will be prefixed with FirebasePerformance. To view only the performance logging, enter FirebasePerformance into the logcat filter field as highlighted in Figure 51‑1:
Figure 51‑1
As long as the performance events are being logged performance monitoring is working. Take some time to interact with the app by adding, finding and deleting database entries. Also move the app between background and foreground modes. Once some data has been recorded, all that remains is to review the data in the Firebase console.
Reviewing Performance Data in the Firebase Console
After sufficient time has elapsed for the Firebase console to begin displaying performance data, open the Firebase console in a browser window and select the Firebase Examples project followed by the Performance Monitoring entry in the left-hand navigation panel. Within the Performance Monitoring screen, select the RealtimeDBList app from the dropdown menu as shown in Figure 51‑2:
Figure 51‑2
If the Performance Monitoring page for the app provides instructions to install the SDK, it may be necessary to wait longer for the data to be ready for analysis.
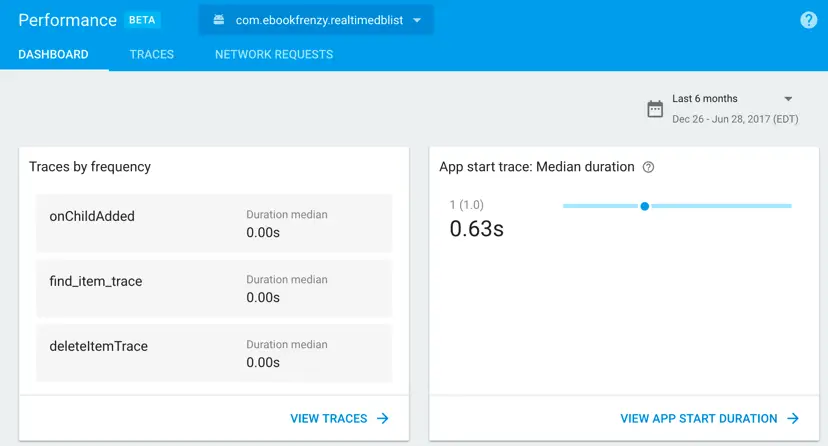
Once Firebase has begun presenting data, the performance dashboard (Figure 51‑3) will appear providing a summary of the performance data collected for the app:
Figure 51‑3
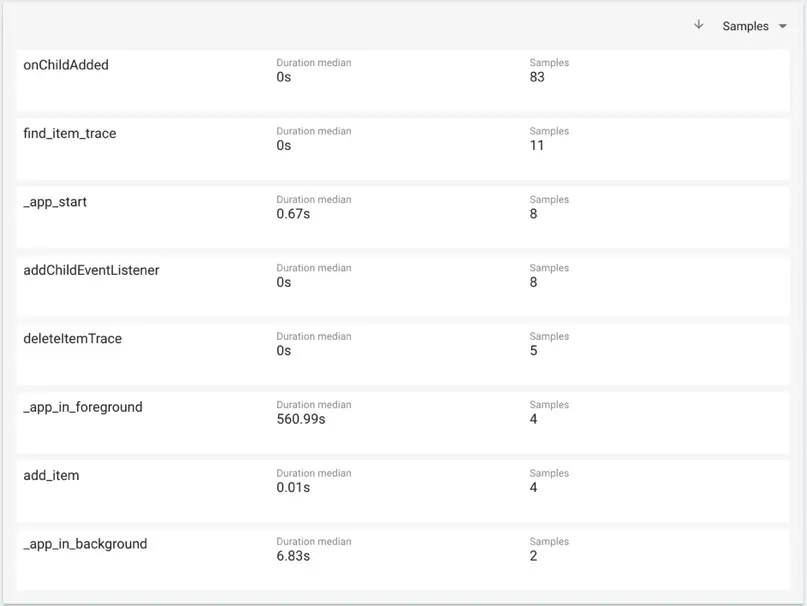
The screen also includes tabs to access detailed information on traces (Figure 51‑4) and network requests. Each screen provides options to filter the results and to specify different date ranges:
Figure 51‑4
To view additional performance details for a trace, select it from the list to display the trace detail screen. Figure 51‑5, for example, shows data for the add_item trace including the trace counter. Clicking on the View More link will display information based on the device type, app version, operating system and network characteristics:
Figure 51‑5
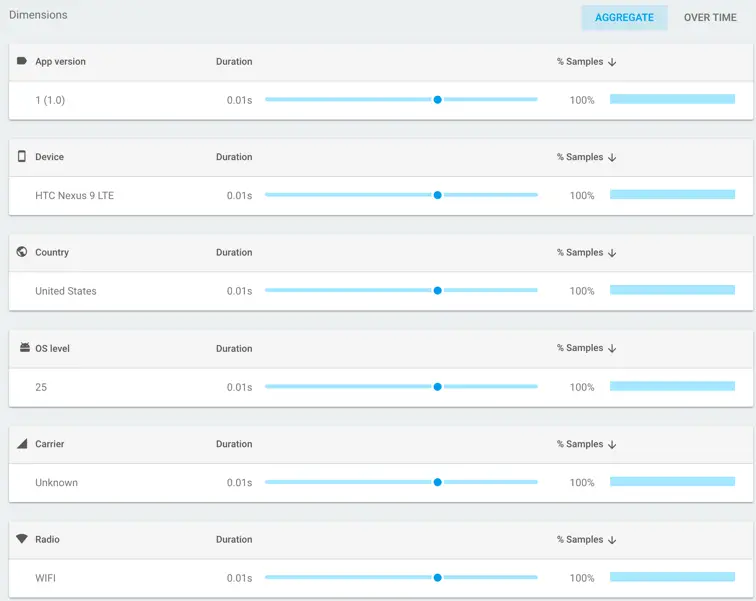
Metrics can be displayed in either Aggregate or Over Time mode by selecting the corresponding buttons. Aggregate mode displays the median value for the current metric together with a percentile distribution slider. Hovering the mouse pointer over the slider and moving it left or right changes the percentile value and displays the corresponding metric value. Figure 51‑6, for example, shows the duration metric for the 25th percentile:
Figure 51‑6
The Over Time view shows the trace metrics and the median value indicating the amount by which the metric changed over the currently selected period of time.
Turning Off Performance Monitoring
To disable automatic trace monitoring at build time, simply add the following line to the project’s gradle.properties file (located under Gradle Scripts within the Android Studio tool window).
firebasePerformanceInstrumentationEnabled=false
Note this setting only disables automatic traces and that custom traces will continue to be monitored. Performance monitoring (both automatic and custom) may be disabled by placing the following entry within the application element of the AndroidManifest.xml file:
<application ...>
.
.
<meta-data android:name="firebase_performance_collection_enabled"
	android:value="false" />
.
.
</application>
When disabled in this way, performance monitoring may be re-enabled from within the app by making a call to the setPerformanceCollectionEnabled() method of the FirebasePerformance instance, passing through a true value:
FirebasePerformance.getInstance().setPerformanceCollectionEnabled(true);
Performance monitoring can be disabled using the same method call, passing through a false value. Combining this feature with Firebase Remote Config (a topic covered in the chapter entitled Firebase Remote Config) provides an easy way to enable and disable performance monitoring after the app is live within the Google Play Store.
To deactivate performance monitoring such that it cannot be reactivated via the app code, add the following element to the AndroidManifest.xml file:
<application ...>
.
.
<meta-data android:name="firebase_performance_collection_deactivated"
	android:value="true" />
.
.
</application>
Summary
Firebase Performance Monitoring offers an easy way to monitor the performance of an app. Performance is monitored using traces that measure app performance at certain periods of execution. Once the performance monitoring library has been added to an app a number of trace metrics are monitored automatically. Custom traces may also be implemented by making trace start and stop method calls within the app. Once performance information has been gathered, the data is analyzed within the Performance Monitoring section of the Firebase console.
| Previous | Table of Contents | Next |
| A Firebase App Indexing Tutorial | Firebase Cloud Functions |


